Population growth does not necessarily drive higher water consumption. Industry — particularly electric power generation — dominates Michigan's water use regardless of how county populations shift.
Power BI Dashboard
An interactive Power BI dashboard was built alongside the SSRS report, enabling dynamic filtering by year (2013–2021) and instant drill-down across all six visualisations.
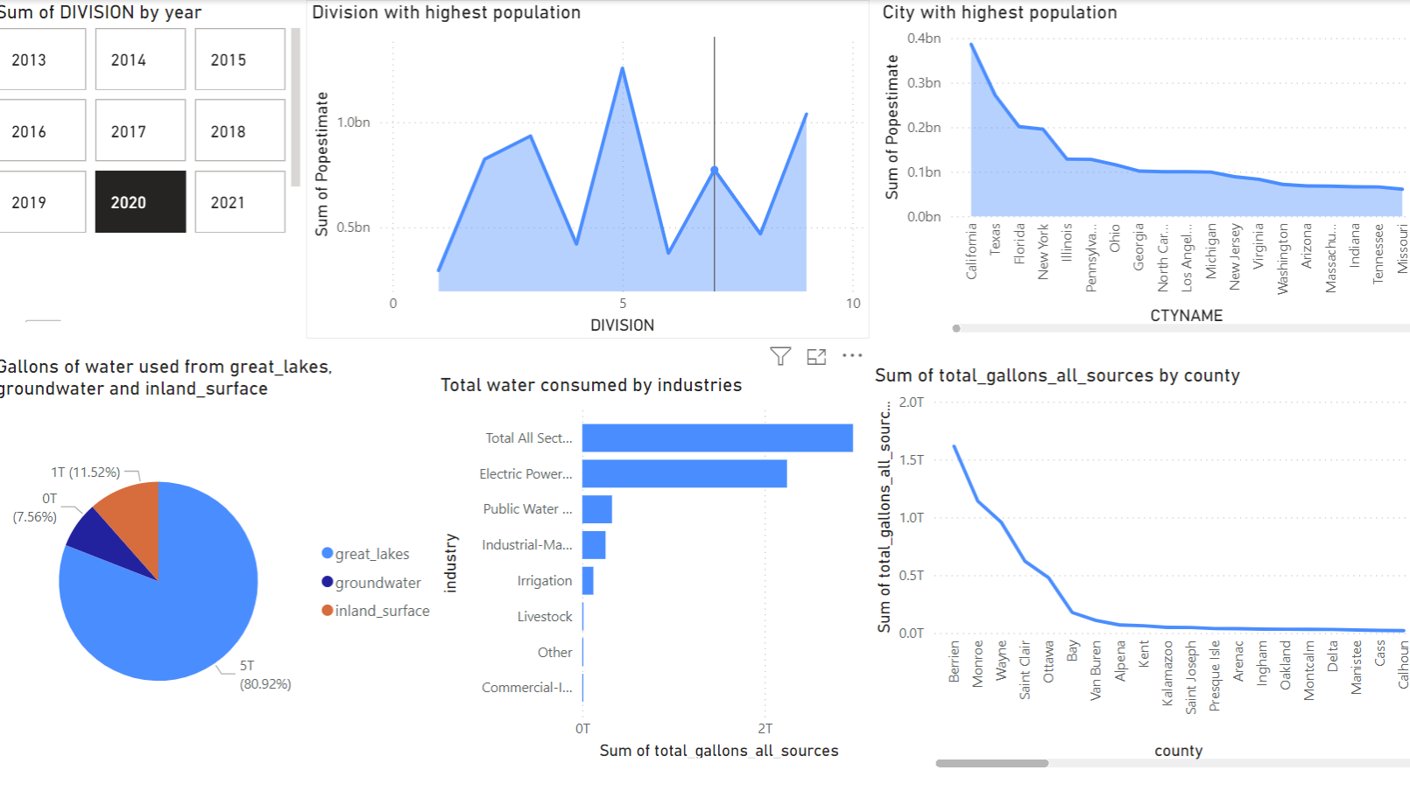
The dashboard contains six linked panels: a year slicer, division population trend, city population ranking, water source breakdown (pie), total consumption by industry (bar), and county-level water use (area chart).
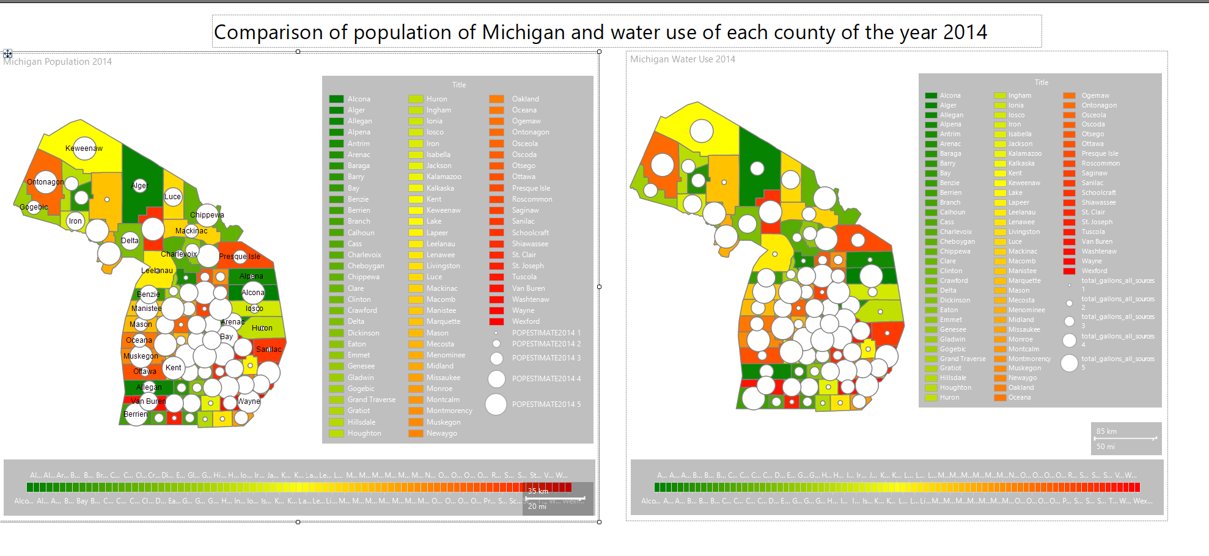
SSRS Choropleth Map
The SSRS report visualises both datasets simultaneously on a side-by-side Mercator-projected map of all 83 Michigan counties, colour-coded by population (left) and water use (right) for the year 2014.
Objective
The original hypothesis was straightforward: more people → more water use. By combining U.S. Census county population data with Michigan's decade-long water use records, we set out to test this assumption. The data told a more complex story.
Datasets
- Michigan Water Use (2013–2022) — Kaggle / Michigan.gov: industry-level water withdrawals broken down by Great Lakes, groundwater, and inland surface water
- County Population Totals (2010–2019) — U.S. Census Bureau: annual county-level estimates for all U.S. counties
Data Cleaning
- Removed unnecessary columns from both datasets
- Unpivoted population estimate columns (wide → long) for trend analysis
- Verified no null values before building reports
Key Findings
SQL Queries
SELECT *
FROM  [co-est2019-alldata]
WHERE STNAME = 'Michigan';
SELECT *
FROM  [water_use_data_2013_to_2022]
WHERE year = 2014;
Technical Design
- Multi-datasource SSRS report connecting two SQL Server databases simultaneously
- Mercator-projected choropleth polygon map covering all 83 Michigan counties
- Dynamic colour range rules that auto-scale to data distribution
- Power BI year slicer (2013–2021) enabling cross-panel filtering in real time
- Built in Microsoft Report Builder 15.0 (RDL format) + Power BI Desktop
Conclusion
The Great Lakes dominate as Michigan's water source (~80%). Electric power generation is by far the heaviest industrial consumer, and Berrien County leads all 83 counties in total water use. Most importantly, residential population growth alone is not a reliable predictor of water demand — industrial activity is the dominant driver. These insights can directly inform resource management strategy, environmental policy, and regional infrastructure planning.